
MLN601 Machine Learning Report 2
Assessment 1 considered a wine data set as a regression task. This brief revisits the data set as a classification task. In this Assessment, you will use a decision tree Machine Learning (ML) algorithm to analyse data and draw conclusions. To help you create and document this ML model and the results, you will follow the end-to-end CRoss-Industry Standard Processfor Data Mining (CRISP-DM) (Chapman et al., 2000) methodology. Further, to guide you through the analysis, the development of your report and model, and the writing of your report a template for your Jupyter.
Notebook has been provided with comments. Your presentation should touch on the key steps of the template, including the lessons you learned and your experiences.
You will use your Jupyter Notebook on the Microsoft Azure ML platform or Google Colab and Python 3.6 as the language for all three assessments.
Ultimately, the Notebook will contain both your ML code, data and report documentation.
Your Assessment will be evaluated based on the major stages of the CRISP-DM process as set out in the Notebook template with prompts. The process comprises:
1. Business Understanding;
2. Data Understanding;
3. Data Preparation;
4. Modelling;
5. Evaluation; and
6. Deployment.
The six multi-step stages of the CRISP-DM must be undertaken to complete this Assessment. Note: For ease of working and to complete this Assessment, you should document what you are doing in your
Notebook as you progress through the activities (e.g., the steps undertaken and the rationale for the selection of the code). The template will prompt you on how to work through the end-to-end ML process.
Stage 1: Business Understanding
1. This section serves as an introduction. You should write a clear and concise narrative expressing what you are trying to achieve. Think in terms of ML; for example, the prediction algorithm, the data set selected, what you are seeking from the data set and how you intend to understand the value of your prediction capability.
2. Assessthe current situation. See 1.1 of the CRISP-DM template (1.1).
Stage 2: Data Understanding
1. Acquire the relevant wine quality data set from the UCI repository for your prediction model (https://archive.ics.uci.edu/ml/datasets/wine+quality). Explicitly specify the data source by providing a specific link and the name of the data set (e.g., red wine, white wine or both) and the method of acquisition (e.g., direct from the URL or a download of the .csv file). The steps taken need to be clearly stated. (2.1).
2. Read this data set into your Notebook. (2.1).
3. Describe the data set inclusive of variables, units and levels. (2.2).
4. Verify the data quality by analysing the data set for structure and missing data. (2.3).
5. Conduct an initial data exploration using data visualisation, reporting and querying of the data. (2.4).
6. Use the pairplot function in seaborn to determine the relationship, if any, between the variables. Include the output or the visualisation of the pairplot function in your Notebook and comment on it. (2.4.2).
Stage 3: Data Preparation
1. Select the data that you will use for the analysis. (3.1).
2. Clean the data you have selected to improve the quality of the data. (3.2).
Stage 4: Modelling
1. For this Assessment, you are only required to consider one classification modelling technique (e.g., a decision tree).
2. Import the decision tree model in your code. (4.1).
3. Record any modelling assumptions. (4.2).
4. Run your model over the data set. (4.3).
5. Record the parameter settings, your rationale for your choice of values and the actual model generated. (4.3).
6. Revise any parameter settings for subsequent model runs. Document all the revisions until the best model is reached. (4.4).
7. Assess the model or models according to the performance measurement set to meet your evaluation criteria. The AUC-ROC curve is useful for the performance measurement of classification.
8. Revise any parameter settings for subsequent model runs. Document all the revisions until the best model is reached. (4.4).
Stage 5: Evaluation
1. Assess the ML results. Ensure you include a statement as to whether the model meets the initial objective.
Stage 6: Deployment
1. For this Assessment, you are not required to deploy your model. For this stage, simply include any lessons that you learned and that you wish to share in relation to the things that went right and wrong, the areas in which you did well and in which you could improve. You can also detail any of your other experiences in completing this Assessment.
The main purpose of this work is to develop a machine learning decision tree algorithm which classifies white wine quality. The white wine dataset we acquired from UCI Machine Learning Repository includes 11 physicochemical variables consisting of fixed acidity, volatile acidity, residual sugar, chlorides, free sulfur dioxide, total sulfur dioxide, density, pH, sulphates, and alcohol concentration. The model uses these features to determine whether a wine test has high quality or low-quality rating.
The classification problem finds significant worth because it establishes an automated wine quality assessment system that minimizes the need for inconsistent human decision-making. The decision tree algorithm works as an optimal choice due to its effective and readable performance for classification operations. The optimized training process will lead to precise predictions which will produce improved decision quality for wine manufacturers.
Both winemakers and retailers along with consumers need correct wine quality classifications. Manufacturing enhancement processes and improved end product control are achievable through the use of this data by winemaking professionals. The unbiased quality assessment proves beneficial to retailers for establishing correct pricing strategies and marketing approaches. The ratings enable consumers to choose their products for management assignment help wisely with reliable information about their quality.
The dataset used for this research is the White Wine Quality dataset from the UCI Machine Learning Repository. The dataset has 4,898 samples and 12 attributes, which include some of the physicochemical features of the white wine. Some of the attributes include fixed acidity, volatile acidity, citric acid, residual sugar, chlorides, free sulfur dioxide, total sulfur dioxide, density, pH, sulphates, alcohol, and quality.
The data was received as a CSV dataset and was preprocessed for data usability and consistency for machine learning. The data was preprocessed by checking for missing values, renaming the columns for easier understanding, and converting the target variable into a binary classification for the successful training of the model.
Each of the dataset's records is a unique white wine sample with the following features:
.png)
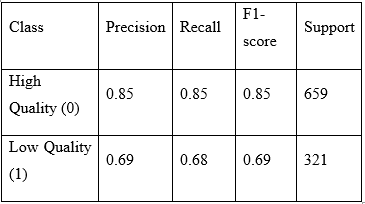
The target variable of the data is the quality, which is a discrete integer rating from 1 to 10. To make the problem a binary classification problem, we transformed the variable of quality as follows:
• Low Quality (1): Those with a rating of less than 6
• High Quality (0): Those with rating of 6 and above
It can be utilized for training a classification model that will be able to classify a wine sample as being of the high- or low-quality variety based on its physicochemical features.
• The dataset has 4,898 observations with 12 columns.
• The dataset had no missing values, thus being gap-free and ready for modeling.
• The distribution of wine quality scores indicates that most of the wines cluster around the interval of 5-7, with fewer cases of the extreme values (scores of 1 and 10) (Cortez et al., 2009).
• Pairplot analysis using Seaborn was conducted for the examination of relationships between features. Some of the results are:
• Alcohol content and sulphates show a positive association with wine quality, which means that higher alcohol content and sulphate levels correspond with higher-quality wines.
• Some of the traits, such as density and residual sugar, exhibit limited correlation with quality, which indicates that these can be less predictive of wine classification.
• This exploratory analysis provides valuable insights into the data, which will be useful for feature selection for the development of the decision tree classification model. Data preprocessing and feature selection follow as the next step for enhancing the performance of the model.
The data consists of 11 independent variables of the physicochemical features of white wine and a single dependent variable (quality), the classification goal.
For feature selection:
All 11 features other than quality were selected as input variables (X).
Quality was converted into a binary classification variable (y) as follows:
Low Quality (1): Those with a rating of less than 6
High Quality (0): Those with a rating of 6 and above
This is required because the model will now be performing a binary classification task, for which classification algorithms such as Decision Trees can be easily used.
.png)
• The dataset was split into training and test subsets for effective training and evaluation of the model using the train_test_split function of the scikit-learn library:
• 80 percent of the data was allocated for the training set for the reason of enabling the model to learn from a vast number of samples.
• 20 percent of the data was reserved for the test set for measuring the model's generalizability for new data.
• This randomized split keeps the model from being biased toward any particular subset of the data and provides a representative estimate of its performance.
• A Decision Tree Classifier was selected for this classification task. The following are the reasons for the selection:
• Decision trees are very interpretable, and it is easy to identify which features contribute most toward the classification.
• They deal with non-linear relationships of the data well.
• They don't require big feature scaling or normalization.
• The Decision Tree model was originally trained with default settings for the aim of establishing a baseline performance.
• To improve the model and avoid overfitting, the following was tuned for hyperparameters with GridSearchCV:
• max_depth – controls the depth of the tree for preventing overfitting.
• min_samples_split – the minimum number of samples required for splitting a split of the internal node.
• min_samples_leaf – indicates the minimum number of samples present in the leaf nodes for avoiding overfitting.
• The optimum decision tree configuration was established by successive tuning of these parameters, which improved the model's classification power.
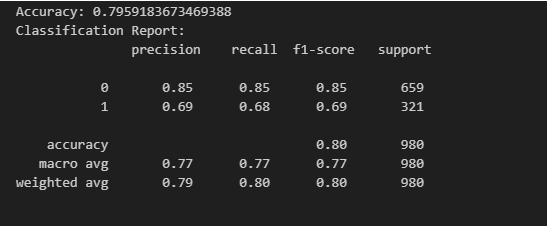
The optimized Decision Tree model was 79.6% accurate, with approximately 80% of the wine samples being correctly labelled as being of high or low quality.
The model's detailed performance is summarized in the classification report:
• Precision: Measures the number of the predicted "high-quality" or "low-quality" wines that were correctly classified.
• Recall: Reminds of the number of actual high- and low-quality wines the model correctly identified.
• F1-score: A balanced measure that considers precision and recall, providing a better evaluation of the model's effectiveness.
• To analyze the model's capacity for distinguishing high from low-quality wine, AUC-ROC (Area Under the Receiver Operating Characteristic Curve) analysis was performed.
• The AUC was 0.77, indicating a moderate classification ability.
• A higher AUC would reflect higher separability of the two classes, but the current score shows that the model is reasonably effective at wine quality separation.
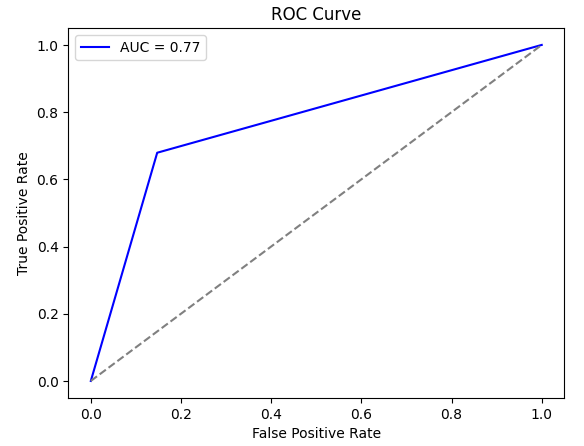
• The ROC curve is a plot of the True Positive Rate (TPR) vs. the False Positive Rate (FPR) for different classification thresholds (Chapman et al., 2000). The higher the model, the closer the AUC will be to 1.
• The blue curve on the ROC plot shows model performance.
• The dashed, light-gray diagonal is the representative of a random classifier.
• Our model, with AUC of 0.77, is superior to guessing randomly but still has room for improvement.
• The Decision Tree classifier is interpretable and is also transparent.
• The model achieves a relatively high accuracy of 79.6%.
• Precision is higher for high-quality wines (85%), and it is, therefore, useful for the prediction of high-quality wines.
• The model struggles with low-quality wines (69% accuracy), as it tends to classify low-quality wines.
• Decision Trees can be prone to overfitting, which prevents generalization on new data (UCI, 2019).
• The data is imbalanced with a higher number of high-quality wines, potentially affecting model performance.
Model Improvements
To improve the classification ability of the model, the following can be employed:
• Hyperparameter Tuning: Hyperparameter tuning of the values of max_depth, min_samples_split, and min_samples
• Feature Engineering: Creating new features or interactions between existing ones may potentially improve predictive power.
• Ensemble Methods: Combining Decision Trees into Random Forest or Gradient Boosting can lead to better performance.
• Class Imbalance: Class imbalance can be handled by using SMOTE (Synthetic Minority Over-sampling Technique).
Deployment strategy
• The model can be utilized for real-world application as:
• Web API for wine quality analysis tool integration.
• Cloud deployment on platforms like AWS, Azure, or Google Cloud.
Real-time analysis embedded system for wineries. Conclusion This work developed a machine learning predictor of white wine quality using Decision Trees. The predictor was 79.6% accurate with AUC-ROC of 0.77. The model is suitable for the classification of high-quality wine, but improvement can be achieved for the prediction of low-quality wine. Future work will be aimed at developing the model further and creating more sophisticated classification approaches.
Chapman, P., Clinton, J., Kerber, R., Khabaza, T., Reinartz, T., Shearer, C. & Wirth, R. (2000). CRISP-DM 1.0—Step-by-step data mining guide. Copenhagen, Denmark: SPSS Inc. https://www.the-modeling- agency.com/crisp-dm.pdf
Cortez, P., Cerdeira, A., Almeida, F., Matos, T. & Reis, J. (2009). Modeling wine preferences by data mining from physicochemical properties. Decision Support Systems, Elsevier, 47(4), 547–553. https://archive.ics.uci.edu/ml/data sets/wine+quality
UCI (2019). Machine learning repository. Irvine, CA: University of California, School of Information and Computer Science. http://archive.ics.uci.edu/ml


Essay: 10 Pages, Deadline: 2 days
They delivered my assignment early. They also respond promptly. This is excellent. Tutors answer my questions professionally and courteously. Good job. Thanks!
![]() User ID: 9***95 United
States
User ID: 9***95 United
States
Report: 10 Pages, Deadline: 4 days
After sleeping for only a few hours a day for the entire week, I was very weary and lacked the motivation to write anything or think about any suggestions for the writer to include in the paper. I am glad I chose your service and was pleasantly pleased by the quality. The paper is complete and ready for submission to the professor. Thanks!
![]() User ID: 9***85 United
States
User ID: 9***85 United
States
Assignment: 8 Pages, Deadline: 3 days
I resorted to the MBA assignment Expert in the hopes that they would provide different outcomes after receiving unsatisfactory results from other assignment writing organizations, and they genuinely are fantastic! I received exactly what I was looking for from this writing service. I'm grateful.
![]() User ID: 9***55
User ID: 9***55
Assignment: 13 Pages, Deadline: 3 days
Incredible response! I could not believe I had received the completed assignment so far ahead of the deadline. Their expert team of writers effortlessly provided me with high-quality content. I only received an A because of their assistance. Thank you very much!
![]() User ID: 6***15 United
States
User ID: 6***15 United
States
Essay: 8 Pages, Deadline: 3 days
This expert work was very nice and clean.expert did the included more words which was very kind of them.Thank you for the service.
![]() User
ID: 9***95 United
States
User
ID: 9***95 United
States
Report: 15 Pages, Deadline: 5 days
Cheers on the excellent work, which involved asking questions to clarify anything they were unclear about and ensuring that any necessary adjustments were made promptly.
![]() User ID: 9***95 United
States
User ID: 9***95 United
States
Essay: 9 Pages, Deadline: 5 days
To be really honest, I can't bear writing essays or coursework. I'm fortunate to work with a writer who has always produced flawless work. What a wonderful and accessible service. Satisfied!
![]() User ID: 9***95
User ID: 9***95

Essay: 12 Pages, Deadline: 4 days
My essay submission to the university has never been so simple. As soon as I discovered this assignment helpline, however, everything improved. They offer assistance with all forms of academic assignments. The finest aspect is that there is also an option for escalation. We will get a solution on time.
![]() User ID: 9***95 United
States
User ID: 9***95 United
States
Essay: 15 Pages, Deadline: 3 days
This is my first experience with expert MBA assignment expert. They provide me with excellent service and complete my project within 48 hours before the deadline; I will attempt them again in the future.
![]() User ID: 9***95 United
States
User ID: 9***95 United
States