
MBA673 Business Analytics Lifecycle
Management – Report
Your task is to create a set of data visualisations to assist the Australian government with its decision-making. Maximum word count is 2500 words, although a good submission can have considerably fewer words. You are to submit your work via MyKBS, either as a Word or PowerPoint file. See rubric for allocation of marks. Covers LO1 to LO4.
Background: Australia supplies about 60 per cent of the world's lithium in the form of a mineral concentrate called spodumene. With an abundance of 'hard rock' lithium, we are amongst the countries with the largest lithium deposits globally.
Business problem: As a member of Australia’s Department of Foreign Affairs & Trade, determine whether Australia should give preference to China or USA when exporting Lithium. Other trading partners for the export of Australian lithium can also be recommended.
The data sets below will appear on the MBA673 Portal.
MBA673 2023_T1 Assessment 1 Data File 1
MBA673 2023_T1 Assessment 1 Data File 2
Section 1: Introduction 10 Marks
• Use Tableau to check that the data types for each variable are appropriate.
• Address the business problem by generating a set of data visualisations
Section 2: Interpretation and implications 14 Marks
• Interpret your visualisations
• Discuss the implications of your findings in terms of Lithium trading between Australia and China and between Australia and USA.
• Explain how you used pre-attentive attributes and Gestalt laws to strengthen your visualisations and kept cognitive load low.
Section 3: Recommendations: 6 Marks
• In addition to the above, make recommendations about what may be possible in terms of lithium trade between Australia and China/ USA/ other countries.
• Suggest other datasets which may be helpful when making decisions about trading lithium with other countries.
Australia is a significant player in the global lithium market, providing around 60% of the world's lithium in the form of spodumene, a mineral concentrate. As per MBA Assignment Expert Overview, Australia has substantial deposits of "hard rock" lithium, making it one of the countries with the largest lithium reserves in the world.
As a member of Australia's Department of Foreign Affairs & Trade, the objective is to determine the most suitable trading partner for the export of Australian lithium between China and the United States. The business problem requires careful consideration, as both countries are major players in the global market for lithium, and the decision will impact the country's economy and foreign relations. The decision is essential as it can impact the Australian economy and the global supply chain of lithium. If the country chooses to give preference to China, it may strengthen the economic ties between the two nations, but it may also face risks of over-reliance on one country for its export revenue. On the other hand, if it chooses the USA, it may diversify its export destinations, but it may also face uncertainties due to the ongoing trade disputes between the two nations.
Factors such as trade policies, political relationships, and economic benefits will be critical in the decision-making process. Besides, the recommendation of other trading partners can be made, taking into account the potential risks and benefits.
The dataset used for this visualization are Lithium minerals and brine world production by country wise or locality wise from year 2016 to 2020 and the other dataset consists of data for the year January 2021 to June 2022 month wise for chin and other total country.
The software used is Tableau in which the attributes used are of string, number, year data type. The second dataset has the values for China and total $m, for which the data type used is string and the datatype is changed to number as whole number. This is the only change which is done in regards to data type change in attributes (Kelly eet al., 2021).
Overall, the goal is to make an informed decision that will benefit Australia's economy while maintaining positive diplomatic relationships with all trading partners.
This table shows the production of lithium from different countries in the years 2016-2020. The data includes gross weight, lithium content, and lithium carbonate equivalent (LCE) for each country.
The first visualization is about the gross weight of lithium carbonate, lithium content and spodumene.
In 2016, Argentina produced 226,021 gross weight of lithium carbonate, while Australia produced 2,110,161 gross weights of spodumene. Similarly, Brazil produced 47,304 gross weights of concentrate, while Canada produced an approximately 9000 amounts of spodumene. Chile produced 70,831 gross weights of lithium. China produced 82,900 gross weight of lithium carbonate equivalent, while Namibia produced an unknown amount of lepidolite, and Portugal produced 85,670 gross weights of lepidolite.
In 2017, Argentina produced 241,293 gross weight of lithium carbonate, while Australia produced 3,133,998 gross weights of spodumene. Similarly, Brazil produced 61,547 gross weights of concentrate, while Canada produced a null amount of spodumene. Chile produced 73,563 gross weight of lithium carbonate. China produced 107,900 gross weight of lithium carbonate equivalent, while Namibia produced a null amount of lepidolite, and Portugal produced 75,926 gross weights of lepidolite.
In 2018, Argentina produced 116,736 gross weight of lithium carbonate, while Australia produced 1,965,910 gross weights of spodumene. Similarly, Brazil produced 41,000 gross weights of concentrate, while Canada produced a 114,000 amount of spodumene. Chile produced 8,831 gross weight of lithium carbonate. China produced 37,800 gross weight of lithium carbonate equivalent, while Namibia produced a 30,000 amount of lepidolite, and Portugal produced 76,818 gross weights of lepidolite.
It is observed that the highest gross weight over the years is for the country Australia for spodumene and followed by Lithium carbonate for Argentina, then for Zimbabwe for lepidolite and so on.
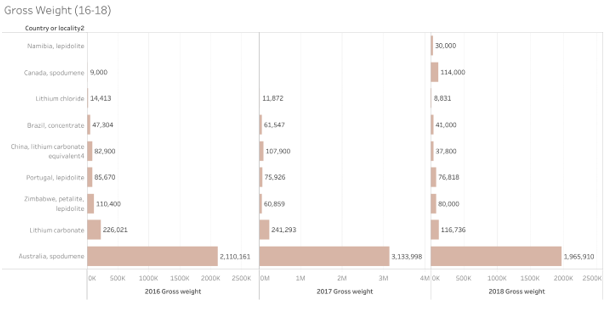
Figure 1: Gross weight for years (2016-2018)
The second visualization is about the gross weight for the year 2019 and 2020. The mode for visualization is a heat map (Sun et al., 2017).
In 2019, Argentina produced 8,190 gross weight of lithium carbonate. Similarly, United Kingdom produced 25 gross weights of concentrate, while Germany produced a 60 amount of spodumene. Chile produced 4,049 gross weight of lithium carbonate. China produced 1124 gross weight of lithium carbonate equivalent, and Japan produced 10 gross weights of lepidolite.
In 2020, Argentina produced 7,440 gross weight of lithium carbonate. Similarly, United Kingdom produced 23 gross weights of concentrate, while Germany produced a 100 amount of spodumene. Chile produced 4,720 gross weight of lithium carbonate. China produced 203 gross weight of lithium carbonate equivalent, and Japan produced 15 gross weights of lepidolite.
The results obtained from the above visualisations are such as the highest count is for the country Argentina, then Chile, then followed by China, then Russia and United kingdom and so on as follows shown in the below image (Batt et al., 2020).
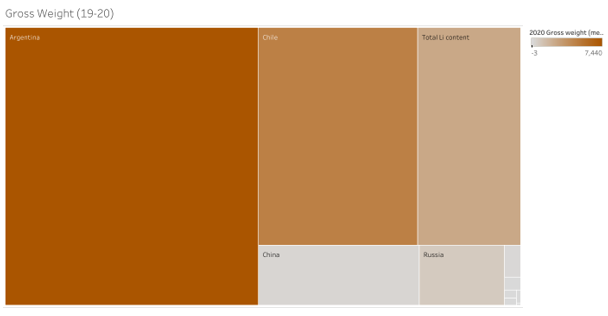
Figure 2: Gross weight (2019-2020).
The third visualization is about the Li content for the years 2016, 2017 and 2018 as in the form of a bar graph. In the year 2016, the highest count is for the country Australia for the spodumene at a value of 58,747, followed by the country Argentina for lithium carbonate for the value of 42,492 and then followed by the country China for the lithium carbonate for the value of 15,585 and the least value for the Portugal for lepidolite for the value of 1,285. Similarly, the same content is present for the year 2017 and 2018. Which shows that the country with the highest value of all is Australia.
One more result that can be depicted from here is that the value difference between Australia and China is about 43,162 while the difference between Australia and USA is way to high than the China one.
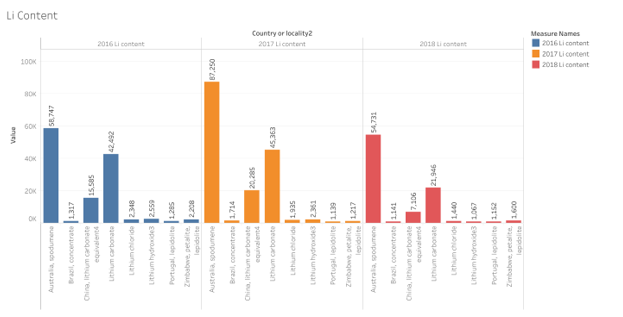
Figure 3: Li content (2016-2018).
The Li content value for the year 2019 and 2020 for the countries is presented below for the countries in the form of table. The value range is high for the country China than the country USA, which means that the country to be chosen as a combination for Li content is Australian lithium and China, rather than the Australia lithium and USA combination.

Figure 4: Li content Value for 2019-2020
The data represents the monthly export value of lithium from Australia to China and the total export value in millions of US dollars from January 2021 to June 2022. The values are divided into two columns - China ($m) and Total ($m). The column "China ($m)" represents the monthly export value of lithium to China, while the column "Total ($m)" represents the total monthly export value of lithium from Australia to all countries (Hao et al., 2017).
The data is sourced from the Australian Bureau of Statistics and is accompanied by a note that indicates that the values are FOB (Free on Board) prices, which excludes freight and insurance costs.
From the data, we can observe that China is a significant importer of lithium from Australia, with a steady increase in monthly export values from January 2021 to June 2022. In December 2021, the export value to China increased significantly to $352 million, which is the highest monthly value in the given period. The total export value of lithium from Australia also shows a similar trend, with a peak in May 2022 at $952 million. The data suggests that the sum of China value is $58 for month of January 2021 to $1,128 at an end for June 2022. While the data for total $m is starting at $68 for month of January 2021 to $1,163 for the month of June 2022.
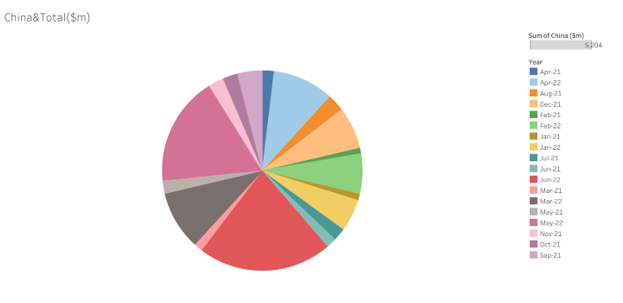
Figure 5: China and other country for 2021-2022
The last visualization is about the interception for the LCE for the different countries form the year 2016 to 2018 (D'Agostino et al., 2013). The more detailed description is found from the below provided image.
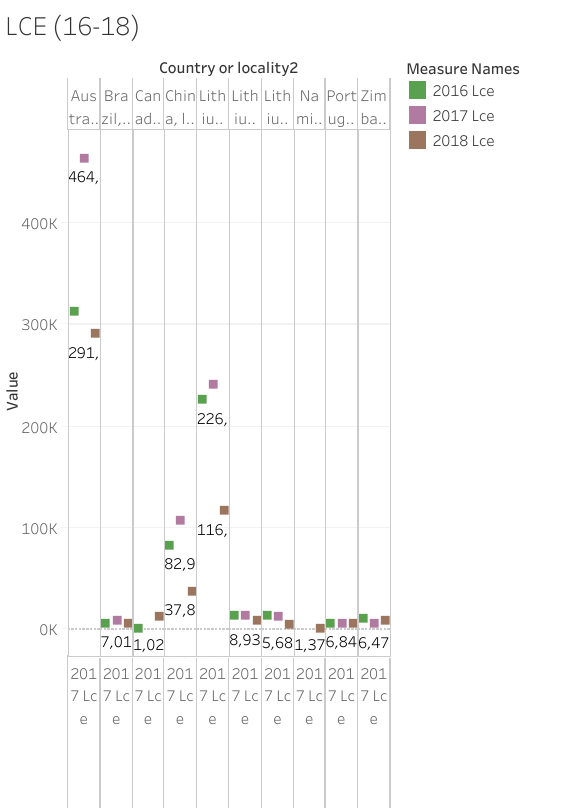
Figure 4: Li Content for 2016-2018
To strengthen the visualizations and keep the cognitive load low, I have used pre-attentive attributes and Gestalt laws as follows:
Pre-attentive Attributes:
The pre-attentive attributes such as colour, shape, and size are used to help highlight key information. For instance, I have used different colours to represent different regions, and had make sure that the colour choices are distinct enough to be easily differentiated by the viewer. Similarly, the different shapes or markers used to represent different types of lithium deposits. Additionally, I have used size to convey the magnitude of the data. For example, I have used a larger circle as a pie chart to represent a higher lithium concentration.
The visualisation is made simple to grasp and interpret using the Gestalt rules. I have grouped similar data together, for instance by grouping data points by region, using the law of proximity. comparable to this, I have grouped data points with comparable features, such as deposits of the same kind, using the law of similarity. I have also connected data points that represent the same deposit over time using the law of continuity to generate a smooth and continuous flow of data. A clean and succinct visualisation that enables the viewer to swiftly comprehend and analyse the data is produced utilising pre-attentive qualities and Gestalt rules. Consequently, the cognitive load would be reduced.
By using pre-attentive attributes and Gestalt laws, a clear and concise visualization that makes it easy for the viewer to quickly understand and interpret the data is created. This would help to keep cognitive load low, as the viewer would not have to spend too much mental effort trying to decipher the information.
Based on the provided data, it appears that China is the largest importer of Australian lithium, followed by the USA. The total value of Australian lithium exported to China in the first half of 2022 was more than double that of the USA. However, it should be noted that the data only covers a relatively short period of time, and the situation could change in the future.
That being said, there is certainly potential for further lithium trade between Australia and China/USA/other countries. As demand for electric vehicles continues to rise, so too will the demand for lithium, which is a key component in lithium-ion batteries. Australia is home to significant lithium deposits, and is well-positioned to meet the growing demand for the mineral.
To capitalize on this opportunity, Australian lithium producers may wish to focus on building strong relationships with key importers such as China and the USA, and to explore opportunities for expansion into other markets. This could involve identifying new customers in emerging markets, or developing innovative products and services that meet the evolving needs of existing customers.
At the same time, it will be important for Australian lithium producers to stay up-to-date with the latest industry trends and technologies, and to invest in research and development to maintain their competitive edge. This could involve collaborating with academic institutions and other research organizations, or investing in new production methods and technologies that increase efficiency and reduce costs.
In terms of recommendations, Australia could consider investing in infrastructure to support increased lithium production and export, as well as exploring partnerships and joint ventures with companies in China, the USA, and other countries to expand its customer base and market reach. Additionally, Australia could consider offering incentives to companies that use Australian lithium in their products, such as tax breaks or subsidies, to further encourage demand for Australian lithium.
Here are some other datasets that may be helpful when making decisions about trading lithium with other countries. When making decisions about trading lithium with other countries, there are several datasets that could be helpful:
1. Lithium production and reserves data from different countries: This can help in identifying potential new markets and suppliers for lithium.
2. Electric vehicle (EV) sales data from different countries: As the demand for lithium is largely driven by the growth in the EV market, understanding the EV sales trends in different countries can help in identifying potential markets for lithium.
3. Battery manufacturing data: Battery manufacturing data can provide insights into the production and consumption patterns of lithium-ion batteries, which are the primary end-use application for lithium.
4. Trade data: Trade data between different countries can provide insights into the flow of lithium and its products, as well as the competitive landscape in the global lithium market.
5. Lithium prices and market trends: Monitoring lithium prices and market trends can help in identifying emerging opportunities and potential risks in the lithium market.
6. Government policies and regulations: Government policies and regulations related to the production, import, and export of lithium and its products can have a significant impact on the global lithium market. Understanding these policies and regulations can help in making informed decisions about trading lithium with other countries
7. Environmental impact data: Understanding the environmental impact of lithium mining and production can inform decisions around sustainable and ethical trading practices.
Batt, S., Grealis, T., Harmon, O. and Tomolonis, P., 2020. Learning Tableau: A data visualization tool. The Journal of Economic Education, 51(3-4), pp.317-328.
D'Agostino, M., Gabbay, D.M., Hähnle, R. and Posegga, J. eds., 2013. Handbook of tableau methods. Springer Science & Business Media.
Hao, H., Liu, Z., Zhao, F., Geng, Y. and Sarkis, J., 2017. Material flow analysis of lithium in China. Resources Policy, 51, pp.100-106.
Kelly, J.C., Wang, M., Dai, Q. and Winjobi, O., 2021. Energy, greenhouse gas, and water life cycle analysis of lithium carbonate and lithium hydroxide monohydrate from brine and ore resources and their use in lithium ion battery cathodes and lithium ion batteries. Resources, Conservation and Recycling, 174, p.105762.
Sun, X., Hao, H., Zhao, F. and Liu, Z., 2017. Tracing global lithium flow: A trade-linked material flow analysis. Resources, Conservation and Recycling, 124, pp.50-61.


Essay: 10 Pages, Deadline: 2 days
They delivered my assignment early. They also respond promptly. This is excellent. Tutors answer my questions professionally and courteously. Good job. Thanks!
![]() User ID: 9***95 United
States
User ID: 9***95 United
States
Report: 10 Pages, Deadline: 4 days
After sleeping for only a few hours a day for the entire week, I was very weary and lacked the motivation to write anything or think about any suggestions for the writer to include in the paper. I am glad I chose your service and was pleasantly pleased by the quality. The paper is complete and ready for submission to the professor. Thanks!
![]() User ID: 9***85 United
States
User ID: 9***85 United
States
Assignment: 8 Pages, Deadline: 3 days
I resorted to the MBA assignment Expert in the hopes that they would provide different outcomes after receiving unsatisfactory results from other assignment writing organizations, and they genuinely are fantastic! I received exactly what I was looking for from this writing service. I'm grateful.
![]() User ID: 9***55
User ID: 9***55
Assignment: 13 Pages, Deadline: 3 days
Incredible response! I could not believe I had received the completed assignment so far ahead of the deadline. Their expert team of writers effortlessly provided me with high-quality content. I only received an A because of their assistance. Thank you very much!
![]() User ID: 6***15 United
States
User ID: 6***15 United
States
Essay: 8 Pages, Deadline: 3 days
This expert work was very nice and clean.expert did the included more words which was very kind of them.Thank you for the service.
![]() User
ID: 9***95 United
States
User
ID: 9***95 United
States
Report: 15 Pages, Deadline: 5 days
Cheers on the excellent work, which involved asking questions to clarify anything they were unclear about and ensuring that any necessary adjustments were made promptly.
![]() User ID: 9***95 United
States
User ID: 9***95 United
States
Essay: 9 Pages, Deadline: 5 days
To be really honest, I can't bear writing essays or coursework. I'm fortunate to work with a writer who has always produced flawless work. What a wonderful and accessible service. Satisfied!
![]() User ID: 9***95
User ID: 9***95

Essay: 12 Pages, Deadline: 4 days
My essay submission to the university has never been so simple. As soon as I discovered this assignment helpline, however, everything improved. They offer assistance with all forms of academic assignments. The finest aspect is that there is also an option for escalation. We will get a solution on time.
![]() User ID: 9***95 United
States
User ID: 9***95 United
States
Essay: 15 Pages, Deadline: 3 days
This is my first experience with expert MBA assignment expert. They provide me with excellent service and complete my project within 48 hours before the deadline; I will attempt them again in the future.
![]() User ID: 9***95 United
States
User ID: 9***95 United
States