
This assignment contains four questions. You are required to answer all four questions. This is an individual piece of assessment. Make sure your submission is an original submission; this means it must be the creation of the person submitting it. You are required to explain your reasoning and use diagrams where appropriate.
a) Give the definition of GDP and explain what items are not included in its calculation?
b) How is GDP calculated using the expenditure approach?
c) How is GDP calculated using the income approach?
d) Explain the problem of "double-counting" and how it can be avoided in calculating GDP
Assume that an economy is initially operating at the natural rate of output (full employment output). Use the AD-AS model to illustrate graphically the effects on price and output of an increase in government spending and a decrease in the cash rate. Explain your assumptions with respect to the range of aggregate supply of your analysis.
Explain in detail the process of Monetary Policy transmission of an increase in the cash
interest rate. Use relevant graphs to describe how a Central Bank’s action on the interest cash
rate ripple through the economy and lead to the target policy goal. (Three connected diagrams
should be used: (1) money supply and demand (2) investment demand schedule (3) AS/AD
diagram. Interest rates is the variable that connects the first and second diagram).
Using the World Bank’s World Development Indicators database,
https://databank.worldbank.org/home.aspx,
GDP per capita (current) 2006 2009 2014 2019*
Australia
China
India
U.S.
Australia
China
India
U.S.
Australia
China
India
U.S.
*or latest available year
b) Produce a plot for each variable (GDP, gdp growth, inflation) comparing the four countries.
c) What can be inferred with respect to economic growth and price control in each of these economies?
a. Gross domestic product (GDP) is used to measure total economic activities of a country in a specific year. For calculating GDP of a country in a year, As per the MBA Assignment Expert total market prices of all final goods and services, which are produced in the specific year, are taken into consideration.
In calculating GDP, some components are not considered, and these are:
I. Transfer earning
II. Reselling of goods and services
III. Selling of goods and services that are produced in previous years
IV. Imported goods and services that are produced in another country
V. Intermediate goods which are used as inputs in producing another final product
VI. Illegally sold goods and services in the market
b. By applying expenditure method, GDP of a country is measured. In this method, all spending for final goods in a specific year are summarised. The formula of measuring GDP using expenditure approach is shown below:
GDP = C +I + G + (X -M)
In the above equation, C is household consumption expenditure and I is gross private domestic investment. G is government consumption along with public investment expenditures and (X -M) is net exports.
c. By applying income method, GDP of a country is measured. In this method, the incomes of all factors that are used in production in a specific year are summarised.
The formula of measuring GDP using income approach is shown below:
GDP = wages + rent + interest + profit
In the above equation, wages are income of labourers; rent is the income of land; interest is the income of capital and profit is the income of entrepreneur.
d. The problem of “double-counting” exists in measuring GDP of a country in a year. The problem arises when product values of a good or service is included in GDP measurement for more than one. Hence, to avoid this problem, value of final goods and services are considered only by using value-added method (Blouin and Robinson 2020). In this process, value added in every step of production is added to get the actual value of the item.
The full employment output or the natural rate of output implies the economic condition where it produces the highest level of output in the long-run. The vertical portion of the AS curve is known as the Classical range where the economy obtains its full employment output. Increase in government spending and a decrease in the cash rate influence aggregate demand of the economy to increase (Zhang 2021). Decrease in the cash rate increases investment in the economy and this influences aggregate demand to increase further. As a result, the AD curve shifts upward while AS curve remains unchanged. Consequently, the price level and output level also change which is shown by the figure below.
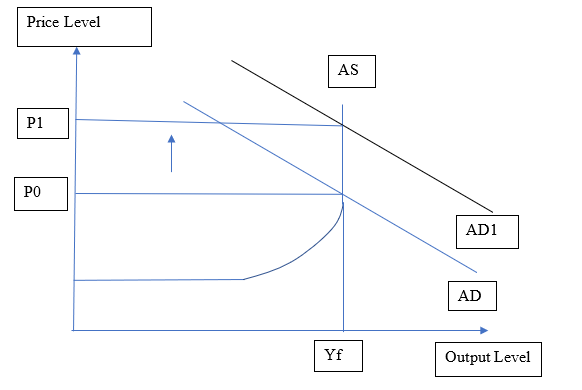
Figure 1: Shift in AD curve
According to figure 1, as AD curve changes its position by shifting upward to AD1, the price level also increases to P1 from P0. However, the output level does not change as the economy is operating at the full employment level.
By applying monetary policy transmission, the central bank takes policy action for meeting the macroeconomic objectives related to economic growth and inflation. The policy can be transmitted in various ways and affects the shortest rate of money market and the liquidity of the banking system (Asaleye et al. 2018). The process of monetary policy transmission is explained with the help of figure below showing that increasing cash rate reduces expenditure in the private sector. As a result, total productivity also reduces in the economy and this further causes both economic activity as well as total employment to decline.
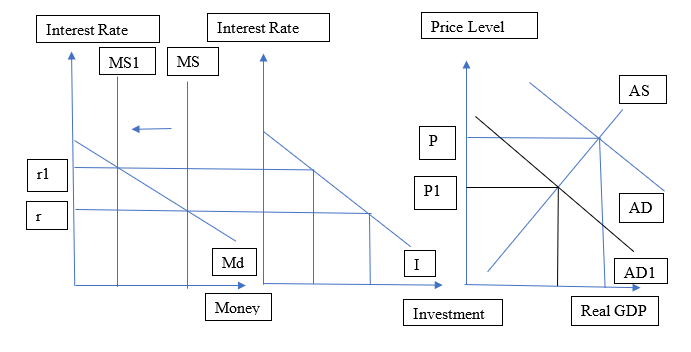
Figure 2: The Process of Monetary Policy Transmission
In figure 2, 3 connected diagrams are drawn where the first one represents money supply and demand curves, second one represents investment demand schedule and the third one represents AS-AD curves. The figure represents the action taken by a Central Bank on the interest rate ripple with the help of economic activities and how it achieves target policy goal. In the first two diagrams, interest rate varies. As cash rate increases, the money supplied in the economy declines and it further declines investment by reducing interest rate. Consequently, aggregate demand declines and the price level also declines along with real GDP.
a.
Table 1: Macroeconomic Indicators of Australia, China, India and U.S
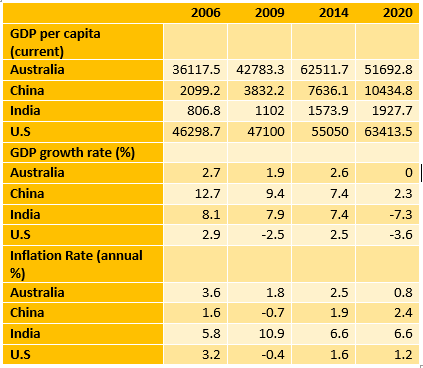
Source: (World Bank, 2022)
b.
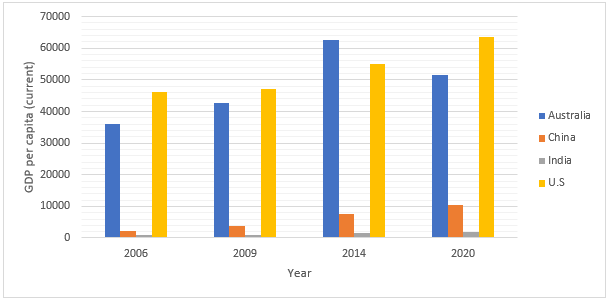
Figure 3: Comparison of GDP per capita (current) between Australia, China, India and US
In 2006, US faced the highest GDP per capita followed by Australia. On the other side, China and India faced comparatively very low GDP per capita in the same year. The scenario was almost identical in 2009. GDP per capita of each country improved in this year compared to previous one. In 2014, GDP per capita of Australia increased significantly and became higher than US. The condition of China and India also increased in the same year. However, in 2020, GDP per capita of US increased again and surpassed Australia. China and India also performed well in this year and consequently their GDP per capita also increased. On the other side, GDP per capita of Australia declined in 2020 compared to that in previous year.
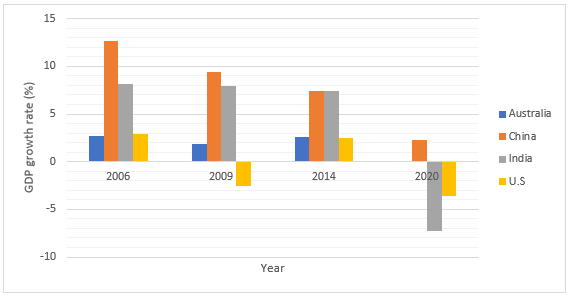
Figure 4: Comparison of GDP Growth rate (%) between Australia, China, India and US
In 2006, China faced the highest GDP growth rate while India faced the second highest one. On the contrary, US and China had low growth rate of GDP. The situation changed in 2009, as GDP growth rate of US became negative. GDP growth rate of China, Australia and India also declined compared to that in 2006. GDP growth rate of US increased in 2014 while that of Australia also improved in this year. On the other side, GDP growth rate of China and India decreased slightly in this year. The growth rate of India and US became negative in 2020 while that of China also declined drastically.
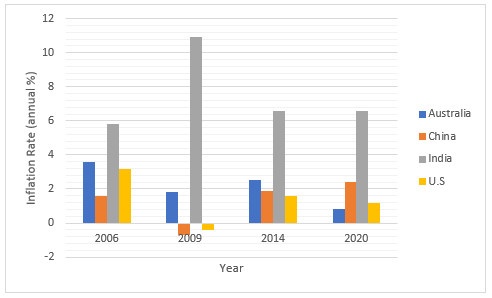
Figure 5: Comparison of Inflation rate (%) between Australia, China, India and US
In 2006, inflation rate of India was comparatively high compared to that of Australia, China and US. The rate of India increased significantly in 2009, which implied poor economic performance. On the other side, both China and US faced deflation in that year. Inflation rate of Australia remained below 2%, which implies economic performance was not affected adversely due to the Global Financial Crisis. The macroeconomic rate of China and US improved again in 2014 and remained below 3% in 2020. The rate was high for India in 2020 while that of Australia declined below 2%.
c.
From the given macroeconomic data, it can be stated that economic performance of Australia was comparatively better due to low inflation rate, high GDP per capita and stable GDP growth rate. China has also improved its economic performance since 2006 considerably. On the other side, India faced high inflation rate and hence it required to control price level by adopting suitable fiscal and monetary policies.
Asaleye, A.J., Popoola, O., Lawal, A.I., Ogundipe, A. and Ezenwoke, O., 2018. The credit channels of monetary policy transmission: implications on output and employment in Nigeria. Banks & bank systems, (13, Iss. 4), pp.103-118. http://www.irbis-nbuv.gov.ua/cgi-bin/irbis_nbuv/cgiirbis_64.exe?C21COM=2&I21DBN=UJRN&P21DBN=UJRN&IMAGE_FILE_DOWNLOAD=1&Image_file_name=PDF/banks_2018_13_4_12.pdf
Blouin, J. and Robinson, L.A., 2020. Double counting accounting: How much profit of multinational enterprises is really in tax havens?. Available at SSRN 3491451. http://faculty.tuck.dartmouth.edu/images/uploads/faculty/leslie-robinson/BlouinRobinson_November2020.pdf
Worldbank 2022. World Development Indicators | DataBank. Available at: https://databank.worldbank.org/indicator/NY.GDP.MKTP.KD.ZG/1ff4a498/Popular-Indicators (Accessed: 02 February 2022).
Zhang, W.B., 2021. Monetary growth with the Solow, Tobin, IS-LM/AD-AS, and Dixit-Stiglitz models synthesized. Indian Journal of Commerce and Management Studies, 12(2), pp.23-37. http://www.ijcms.in/index.php/ijcms/article/download/108/97


Essay: 10 Pages, Deadline: 2 days
They delivered my assignment early. They also respond promptly. This is excellent. Tutors answer my questions professionally and courteously. Good job. Thanks!
![]() User ID: 9***95 United
States
User ID: 9***95 United
States
Report: 10 Pages, Deadline: 4 days
After sleeping for only a few hours a day for the entire week, I was very weary and lacked the motivation to write anything or think about any suggestions for the writer to include in the paper. I am glad I chose your service and was pleasantly pleased by the quality. The paper is complete and ready for submission to the professor. Thanks!
![]() User ID: 9***85 United
States
User ID: 9***85 United
States
Assignment: 8 Pages, Deadline: 3 days
I resorted to the MBA assignment Expert in the hopes that they would provide different outcomes after receiving unsatisfactory results from other assignment writing organizations, and they genuinely are fantastic! I received exactly what I was looking for from this writing service. I'm grateful.
![]() User ID: 9***55
User ID: 9***55
Assignment: 13 Pages, Deadline: 3 days
Incredible response! I could not believe I had received the completed assignment so far ahead of the deadline. Their expert team of writers effortlessly provided me with high-quality content. I only received an A because of their assistance. Thank you very much!
![]() User ID: 6***15 United
States
User ID: 6***15 United
States
Essay: 8 Pages, Deadline: 3 days
This expert work was very nice and clean.expert did the included more words which was very kind of them.Thank you for the service.
![]() User
ID: 9***95 United
States
User
ID: 9***95 United
States
Report: 15 Pages, Deadline: 5 days
Cheers on the excellent work, which involved asking questions to clarify anything they were unclear about and ensuring that any necessary adjustments were made promptly.
![]() User ID: 9***95 United
States
User ID: 9***95 United
States
Essay: 9 Pages, Deadline: 5 days
To be really honest, I can't bear writing essays or coursework. I'm fortunate to work with a writer who has always produced flawless work. What a wonderful and accessible service. Satisfied!
![]() User ID: 9***95
User ID: 9***95

Essay: 12 Pages, Deadline: 4 days
My essay submission to the university has never been so simple. As soon as I discovered this assignment helpline, however, everything improved. They offer assistance with all forms of academic assignments. The finest aspect is that there is also an option for escalation. We will get a solution on time.
![]() User ID: 9***95 United
States
User ID: 9***95 United
States
Essay: 15 Pages, Deadline: 3 days
This is my first experience with expert MBA assignment expert. They provide me with excellent service and complete my project within 48 hours before the deadline; I will attempt them again in the future.
![]() User ID: 9***95 United
States
User ID: 9***95 United
States


Follow up the given below and get a call back from our experts.