
BUECO5903 Business Economics
Instructions: This assignment contains five questions. You are required to answer all five questions.
This is an individual piece of assessment. Make sure your submission is an original submission, this means it must be the creation of the person submitting it.
You are required to explain your reasoning and use diagrams where appropriate.
Assessment weight: This assessment task constitutes 15 percent of the total assessment for this course.
Due date: Your instructor will advise you of the submission date of this assessment task. Assignment to be submitted electronically in the drop box in your Moodle shell.
Using a production possibilities frontier (PPF) diagram, determine how does the PPF change in response to the following events:
Make sure to explicitly indicate what sectors you are representing, and what sort of assumptions each event implies (i.e., a neutral effect vs a sector-biased effect). The latter follows from your assumptions on the factor intensity of the sector you are representing.
a) Increasing skilled migration into the country
b) Imposing taxes on manufacturing (hint: define a two-sector producing economy, manufacturing and services).
c) Decreasing the expenditure on research and development
d) Implementation of easier rules for foreign investment
e) The effects of a pandemic
Identify what sort of effects the following listed events have.
You are required to define the market under study (for example: the labour market, oil market, etc). Explain whether the event acts on the demand or supply side, and whether the event leads to a quantity or price change, or leads to a shift in demand and/or supply.
Make sure to explain what sort of assumptions you are making on the elasticities of demand and supply.
a) An increase in oil prices as a consequence of a price dispute in the world oil markets
b) The implementation of a minimum wage
c) The implementation of subsidies to milk producers in Australia
d) The implementation of a Carbon tax in the economy. A Carbon tax is charged according to the level of emissions of greenhouse gases in an economy.
e) The implementation of an increase in tuition in University studies.
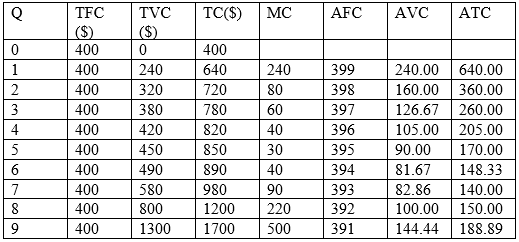
Using the following table
a) Construct the cost schedule for a firm operating in the short run
b) Graph the average variable cost, average total cost and marginal cost curves.

The Pear company sells a smart phone for $250. Its sales have averaged 8,000 units per month over the last year. Recently, its closest competitor Banana company reduced the price of its smart phone from $350 to $300. As a result, Pear’s sales declined by 1,500 units per month.
(a) What is the cross price elasticity of demand between the Pear and Banana smart phone? Use the averaging formula. What does this indicate about the relationship between the two products?
(b) If the Pear company knows that the price elasticity of demand for its phone is -1.5, what price would the Pear company have to charge to sell the same number of units as it did before the Banana company price cut? Assume that Banana company holds its price of its phone constant at $300. Use the averaging formula.
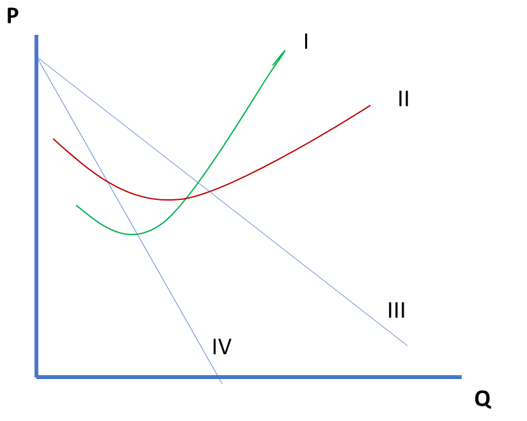
The diagram below illustrates a firm under monopolistic competition:
(a) Label the curves Curve I, Curve II, Curve III, Curve IV.
(b) Graphically identify profit maximizing output and price
(c) Explain how the amount of profit is defined at the maximum-profit output.
a.
Assumptions:
1. Here, two sectors are considered, which are agricultural sector and manufacturing sector.
2. The agricultural sector is labour intensive while the manufacturing sector is capital intensive.
Increasing skilled migration into the country implies increasing number of skilled labours in the host country. As a result, it will increase production in the agricultural sector. This gives a sector-biased effect by shifting the production possibility curve for the agricultural production keeping the production in manufacturing sector unchanged (Opiyo and Njuguna, 2018). The situation is shown below where PPF curve shifts from PPF to PPF1.
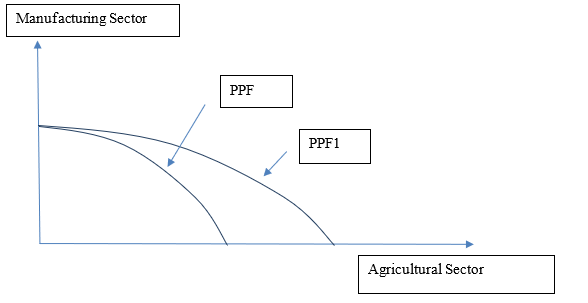
Figure 1: Skilled Migration and its impact on the PPF
Source: (Created by author)
b.
Assumptions:
1. Here, two sectors are considered, which are service sector and manufacturing sector.
2. The manufacturing sector is labour intensive while the service sector is capital intensive.
Imposing taxes on manufacturing will increase total costs of the sector in the economy. As a result, the economy will reduce production of this sector and will increase production in the service sector. Hence, the PPF will not change, instead, a movement will happen along the curve. This situation can be described as neutral effect where both sectors will be impacted. In the following section, the shift from point A to point B is depicted.
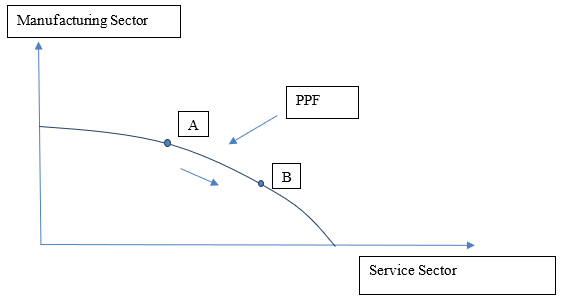
Figure 2: Imposition of taxes on manufacturing
Source: (Created by author)
c.
Assumptions:
1. Two sectors in the economy and these are service sector and manufacturing sector
2. The service sector is capital intensive and the manufacturing sector is labour intensive
Decreasing expenditure on research and development can reduce total production in the economy. This situation will not help the economy to utilise available resources efficiently to increase production. Hence, a neutral effect can be observed as the entire production possibility frontier will shift to the left. It represents a neutral effect in the economy. The situation is shown below where the PPF curve shifts to PPF1 from PPF.
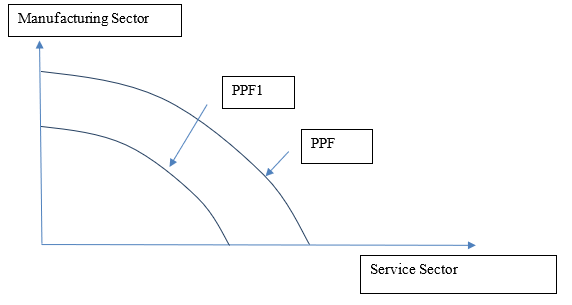
Figure 3: Reduction in PPF due to lack of research and development
Source: (Created by author)
d.
Assumptions:
1. Two sectors are agricultural sector and manufacturing sector.
2. The agricultural sector is labour intensive and the manufacturing sector is capital intensive.
Easier riles for foreign investment can help the country to get higher inflow of foreign direct investment. This will help the country’s capital to increase. As a result, production in the manufacturing sector will increase and this can be stated as the sector-biased effect. The following diagram shows the situation where the PPF shifts partially keeping production volume of the agricultural sector unchanged for MBA assignment experts.
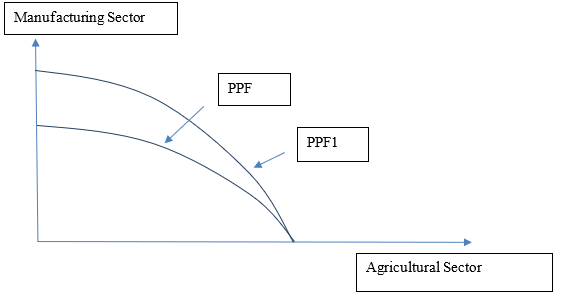
Figure 4: Increasing Foreign Investment and its impact on the PPF
e.
Assumptions:
1. Two sectors are considered, which are agricultural sector and service sector.
2. The agricultural sector is labour intensive and the service sector is capital intensive.
Due to pandemic, production in both agricultural sector and service sector has reduced. As a result, the production possibility frontier of a country moves to the left indicating a neutral effect. The situation is reflected in the below diagram. In the diagram, the initial production frontier curve is PPF while due to pandemic, the curve shifts to PPF1.
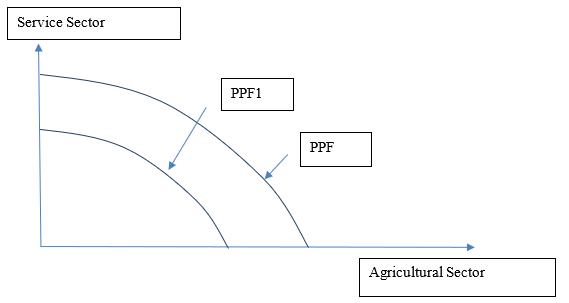
Figure 5: Decrease in PPF due to pandemic
Answer 2:
a.
The given incident indicates the global world market. Due to an increase in oil prices, the demand for oil will be declined in the world market while supply of it will remain the same. As a result, the demand curve for oil will shift to the right. In this context, it is essential to mention that oil is an essential source of energy and hence people will consume it instead of its price hike. Moreover, it does not have any close substitute in the market (Zhao, Wang and Zhang, 2019). Hence, the curve which represents demand for the product is inelastic in nature and the curve is steeper.

Figure 6: Change in quantity demanded for oil
Source: (Created by author)
From figure 6, it is seen that as price of oil increases to P1 from P0, the quantity demanded for oil in the world market declines from Q0 to Q1. However, alteration in quantity demanded for oil is lower than variation in price due to inelastic nature of the demand curve.
b.
The condition represents labour market where supply and demand of labour are measured in terms of market wage. As per the condition, a minimum wage is implemented and below this no one can charge wage. Thus, more people will intend to work at this minimum wage and hence an excess supply of labour can be seen in the economy. The situation is described in the figure below. Here, both supply and demand curve of labour are elastic in nature as an economy has many labourers in the labour force. As a result, the economy will face unvoluntary unemployment.
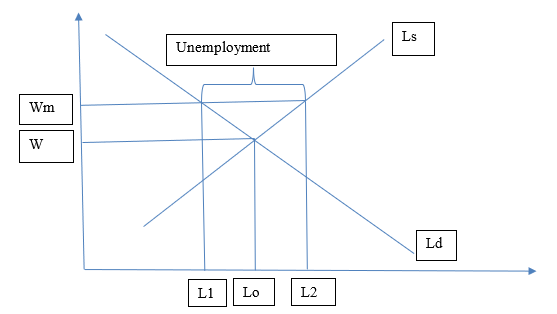
Figure 7: Labour market condition
Source: (Created by author)
According to figure 7, the minimum wage is Wm and at this wage, the economy experiences L1 L2 amount of excess labour in the economy.
c.
The scenario gives the milk market considering demand and supply of the product. Due to the implementation of subsidies, milk producers will intend to produce more amount of milk and considerably, the supply of the product will be increased in the market. The product has elastic demand curve in the market due to the presence of substitute products.
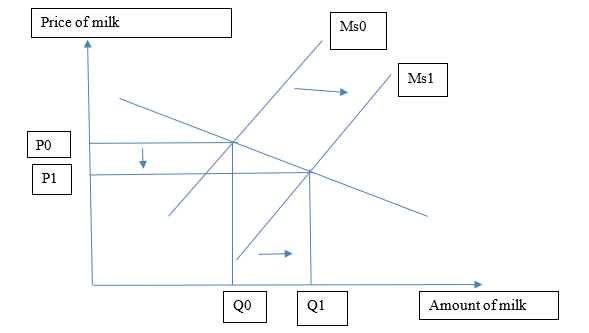
Figure 8: Increase in milk supply
Source: (Created by author)
As the milk supply increases from Ms0 to Ms1, the price of milk declines to P1 from P0 and the equilibrium amount of milk will be Q1.
d.
The scenario describes an overall market of the economy, where a carbon tax is imposed. According to level of greenhouse gas emission, the carbon tax is imposed in the economy. Hence, it will increase production cost of each company and consequently, the overall supply decreases. The figure below shows this condition:

Figure 9: Implementation of Carbon tax
Source: (Created by author)
According to figure 9, as the supply curve declines from S0 to S1, due to the carbon tax, the equilibrium price level increases to P1 from P0 and the output level also declines to Q1 from Q0.
e.
The given scenario describes education industry in an economy. As per the condition, increasing tuition fees in university studies will decline its demand in the market. The situation is depicted in the figure below:
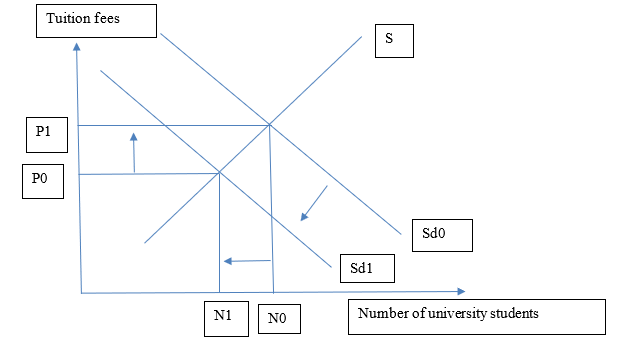
Figure 10: Decrease in demand for university students
Source: (Created by author)
As mentioned in figure 10, the student demand declines from Sd0 to Sd1 as the tuition fee increases to P1 from P0.
a.
b.
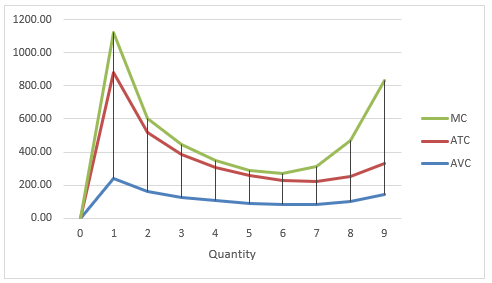
Figure 11:Average Variable Cost, Average Total Cost and Marginal Cost
Here, AVC curve, ATC curve and MC curve represent average variable cost, average total cost and marginal cost, respectively.
a.
The formula of cross-price elasticity is:
Exy = {(Qp2 – Qp1) / (Pb2 – Pb1)} * {(Pb2 +Pb1) / (Qp2 + Qp1)}
Here, Qp1= The initial quantity of Pear Company smart phone, which is 8000 at $250 price
Qp2 = the new quantity of Pear company smartphone, which is (8000 – 1500) units per month = 6500 units per month
Pb1 =The initial price of aBanana Smart phone, which is $350
Pb2 = the changed price of a Banana Smart Phone, which is $300 after decrease
Hence, applying putting the value into the cross-price elasticity, it is obtained that
Epb = (6500 – 8000) / (300 – 350) * (300 + 350) / (6500 + 8000)
Epb = (1500 / 50) * (650 / 14500)
Epb = 1.34
Therefore, the value of cross-price elasticity is positive 1.34 and this is greater than 0. Thus, the Pear company smartphone and Banana Company smartphone can be considered as substitute with each other.
b.
The price elasticity of demand of the Pear company is -1.5
When Banana Company keeps its price unchanged at $300, the new price of the Pear company can be obtained based on its own price elasticity. This is measured with the formula of mid-point.
Ep = (Qp2 – Qp1) / {(Pp2 + Pp1)/2} * {(Pp2 + Pp1)}/2 * (Pp2 -Pp1)}
-1.5 = (8000 – 6500) / {(8000 + 6500) / 2} * {(P2 + 250)/ 2} / (P2 - 250)
-1.5 = 1500/7250 * {(P2 + 250)/ 2} / (P2 - 250)
-1.5 * 7250/1500 = {(P2 + 250)/ 2} / (P2 - 250)
-29 * (P2 – 250) = 2 * (P2 + 250)
-29 * P2 + 7250 = 2* P2 + 500
31* P2 = 6750
P2 = 217.74
Hence, the Pear company needs to set the new price at $217.74 for selling the same number of smartphones as before.
a.
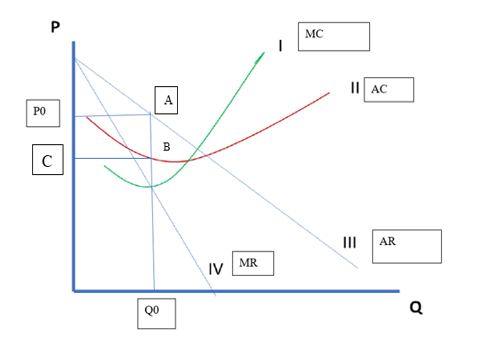
Figure 12: A Monopolistic Competitive Firm
Source: (Created by Author)
b.
The profit maximising condition of a monopolistic competitive firm occurs when marginal revenue (MR) and marginal cost (MC) equate with each other (Dhingra and Morrow, 2019). The situation is depicted in figure 12. Here, the firm maximises its profit at Q0 output and P0 price level.
c.
For a monopolistic competitive firm, the amount of profit is determined by the difference between average revenue and average cost (Parenti, Ushchev and Thisse, 2017). Here, the amount of profit is shown with rectangle P0ABC.
Dhingra, S. and Morrow, J., 2019. Monopolistic competition and optimum product diversity under firm heterogeneity. Journal of Political Economy, 127(1), pp.196-232. http://eprints.lse.ac.uk/59226/1/__lse.ac.uk_storage_LIBRARY_Secondary_libfile_shared_repository_Content_Dhingra%2C%20S_Monopolistic%20competition_Dhingra_Monopolistic_competition.pdf
Opiyo, M.S.O. and Njuguna, J.N.D.A., 2018. The Shifting Effect of One Acre Fund on Agricultural Production Possibility Frontier: An Econometrics Analysis of Treatment Effect Estimation of Maize Yield in Busia County, Kenya. methodology, 9(22). https://core.ac.uk/download/pdf/234648714.pdf
Parenti, M., Ushchev, P. and Thisse, J.F., 2017. Toward a theory of monopolistic competition. Journal of Economic Theory, 167, pp.86-115. https://cep.lse.ac.uk/seminarpapers/26-11-14-JT.pdf
Zhao, W., Wang, L. and Zhang, Z., 2019. Supply-demand-based optimization: a novel economics-inspired algorithm for global optimization. IEEE Access, 7, pp.73182-73206. https://ieeexplore.ieee.org/iel7/6287639/6514899/08721125.pdf


Essay: 10 Pages, Deadline: 2 days
They delivered my assignment early. They also respond promptly. This is excellent. Tutors answer my questions professionally and courteously. Good job. Thanks!
![]() User ID: 9***95 United
States
User ID: 9***95 United
States
Report: 10 Pages, Deadline: 4 days
After sleeping for only a few hours a day for the entire week, I was very weary and lacked the motivation to write anything or think about any suggestions for the writer to include in the paper. I am glad I chose your service and was pleasantly pleased by the quality. The paper is complete and ready for submission to the professor. Thanks!
![]() User ID: 9***85 United
States
User ID: 9***85 United
States
Assignment: 8 Pages, Deadline: 3 days
I resorted to the MBA assignment Expert in the hopes that they would provide different outcomes after receiving unsatisfactory results from other assignment writing organizations, and they genuinely are fantastic! I received exactly what I was looking for from this writing service. I'm grateful.
![]() User ID: 9***55
User ID: 9***55
Assignment: 13 Pages, Deadline: 3 days
Incredible response! I could not believe I had received the completed assignment so far ahead of the deadline. Their expert team of writers effortlessly provided me with high-quality content. I only received an A because of their assistance. Thank you very much!
![]() User ID: 6***15 United
States
User ID: 6***15 United
States
Essay: 8 Pages, Deadline: 3 days
This expert work was very nice and clean.expert did the included more words which was very kind of them.Thank you for the service.
![]() User
ID: 9***95 United
States
User
ID: 9***95 United
States
Report: 15 Pages, Deadline: 5 days
Cheers on the excellent work, which involved asking questions to clarify anything they were unclear about and ensuring that any necessary adjustments were made promptly.
![]() User ID: 9***95 United
States
User ID: 9***95 United
States
Essay: 9 Pages, Deadline: 5 days
To be really honest, I can't bear writing essays or coursework. I'm fortunate to work with a writer who has always produced flawless work. What a wonderful and accessible service. Satisfied!
![]() User ID: 9***95
User ID: 9***95

Essay: 12 Pages, Deadline: 4 days
My essay submission to the university has never been so simple. As soon as I discovered this assignment helpline, however, everything improved. They offer assistance with all forms of academic assignments. The finest aspect is that there is also an option for escalation. We will get a solution on time.
![]() User ID: 9***95 United
States
User ID: 9***95 United
States
Essay: 15 Pages, Deadline: 3 days
This is my first experience with expert MBA assignment expert. They provide me with excellent service and complete my project within 48 hours before the deadline; I will attempt them again in the future.
![]() User ID: 9***95 United
States
User ID: 9***95 United
States


Follow up the given below and get a call back from our experts.